
YOUR HOME DESERVES WORLD CLASS MARKETING BY THE WORLD CLASS REALTOR Peter He
GTA market watch
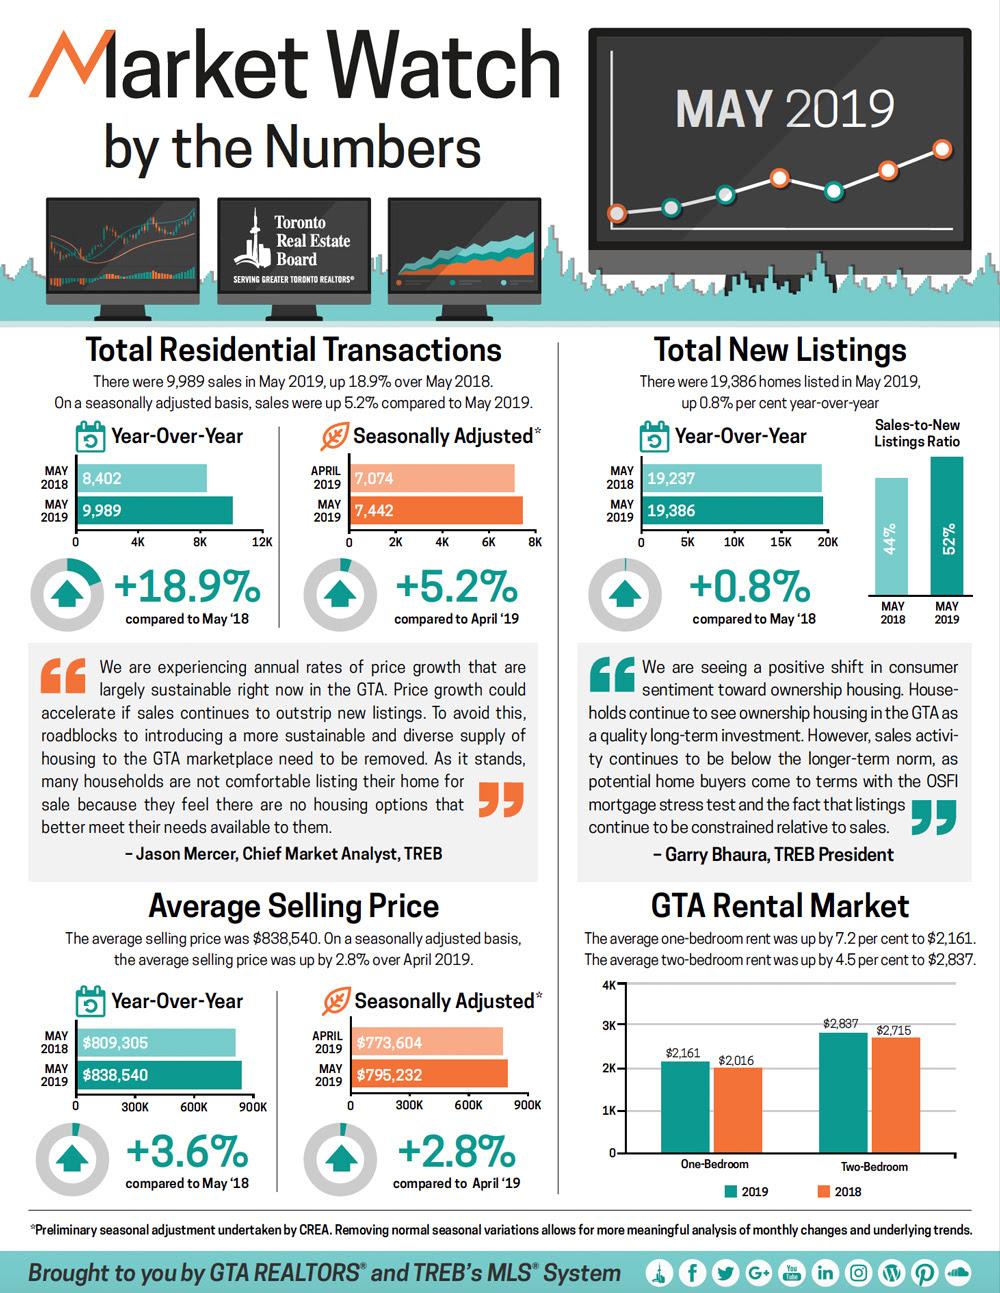
GTA Market Stats- May 2019
GTA Market Stats-April 2019


GTA Real Estate March 2019 Stats
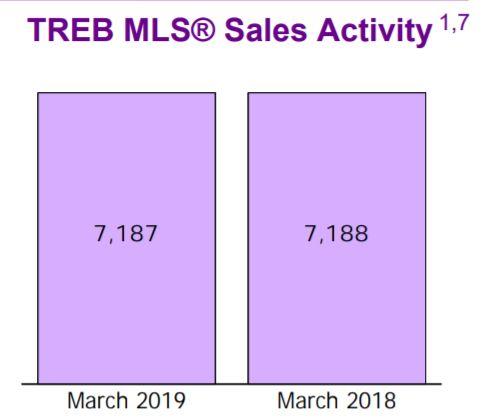
Toronto Real Estate Board announced that Greater Toronto Area REALTORS® reported 7,187 residential sales through TREB's MLS® System in March 2019. This result was inline with 7,188 sales reported in March 2018. For the first quarter of 2019, sales were down by one per cent compared to Q1 2018.
"While the City of Toronto's recently announced Housing TO – 2020-2030 Action Plan is exciting and commendable and TREB looks forward to contributing solutions as a Member of the External Advisory Committee, the recently proposed increase to the Municipal Land Transfer Tax on higher priced properties is problematic. As the recent City budget process showed, the MLTT is not a sustainable revenue source from which to fund municipal programs. On top of this, additional MLTT on higher priced homes could have a trickle-down effect on the supply of homes throughout the housing price continuum," said TREB CEO John Di Michele."The OSFI stress test continues to impact home buyers' ability to qualify for a mortgage. TREB is still arguing that the stress test provisions and mortgage lending guidelines generally, including allowable amortization periods for insured mortgages, should be reviewed. The supply of listings in the GTA also remains a problem. Bringing a greater diversity of ownership and rental housing online, including 'missing middle' home types, should be a priority of all levels of government. TREB is happy to be taking part in the City of Toronto's consultations for the Housing TO – 2020-2030 Action Plan, and will certainly be raising the supply issue during these discussions," said Mr. Bhaura.
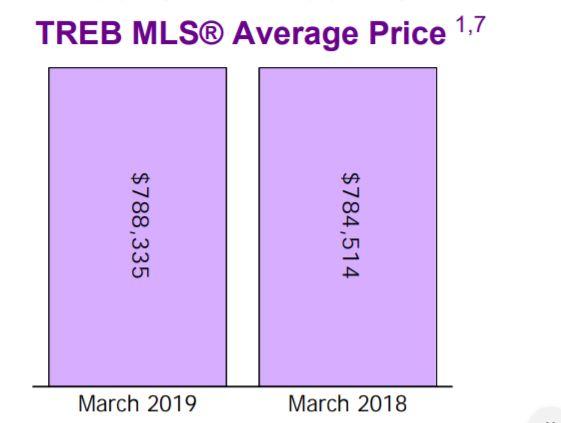
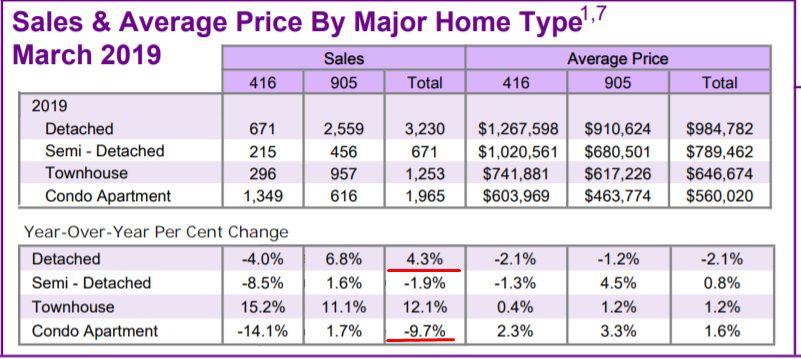
The MLS® Home Price Index Composite Benchmark was up by 2.6 per cent year-over-year in March, while the average price for March sales was up by a lesser annual rate of 0.5 per cent to $788,335. The average selling price for Q1 2019 was up by 1.1 per cent year-over-year.
"Market conditions have remained tight enough to support a moderate pace of price growth. Despite sales being markedly lower than the record levels of 2016 and early 2017, the supply of listings has also receded. This means that in many neighbourhoods throughout the GTA, we continue to see competition between buyers for available listings, which provides a level of support for home prices," said Jason Mercer, TREB's Chief Market Analyst.
GTA Real Estate Market Stats (2019 February)
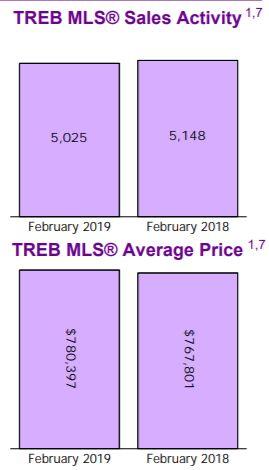
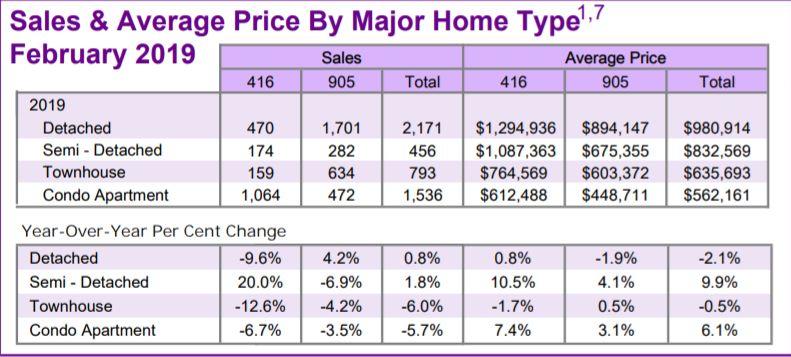
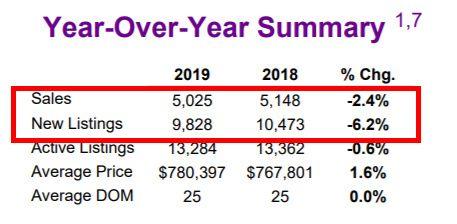
Toronto Real Estate Board President Gurcharan (Garry) Bhaura announced that Greater Toronto Area REALTORS® reported 5,025 homes sold through TREB's MLS® System in February 2019. This sales total was down by 2.4 per cent on a year-over-year basis. Sales were also down compared to January 2019 following preliminary seasonal adjustment.
Despite sales being down year-over-year, new listings actually declined by a greater annual rate. This suggests that market conditions became tighter compared to last year. Tighter market conditions continued to support year-over-year average price growth."The OSFI mandated mortgage stress test has left some buyers on the sidelines who have struggled to qualify for the type of home they want to buy. The stress test should be reviewed and consideration should be given to bringing back 30 year amortizations for federally insured mortgages. There is a federal budget and election on the horizon. It will be interesting to see what policy measures are announced to help with home ownership affordability," said Mr. Bhaura.
Both the MLS® Home Price Index Composite Benchmark and the average selling price were up modestly on a year-over-year basis in February 2019. The MLS® HPI Composite Benchmark was up by 2.4 per cent year-over-year. The average selling price for all home types combined was up by 1.6 per cent over the same period. Price growth was driven by the condominium apartment segment and higher density low-rise home types. On a preliminary seasonally adjusted basis the average selling price was down compared to January 2019.
"Home sales reported through TREB's MLS® System have a substantial impact on the Canadian economy. A study conducted by Altus for TREB found that, on average, each home sale reported through TREB resulted in $68,000 in spin-off expenditures accruing to the economy. With sales substantially lower than the 2016 record peak over the last two years, we have experienced a hit to the economy in the billions of dollars, in the GTA alone. This hit has also translated into lower government revenues and, if sustained, could impact the employment picture as well," said Jason Mercer, TREB's Director of Market Analysis and Service Channels.

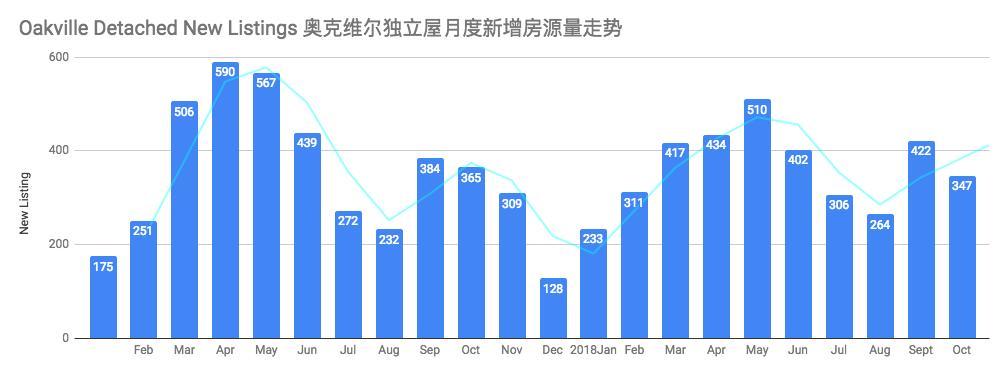
Oakville Detached Home Real Market Watch-2019vs2018&2017
Below is the chart for us to see a big picture how the market is progressing since 2017, as of January 31st 2019, the market seems is picking up than last November&December, please call Peter at 647-7392618 for a full walk through of these charts and what does this mean to buyers and sellers? What's the best timing for you to buy or sell?
GTA Real Estate Market Stats ( January 2019 )
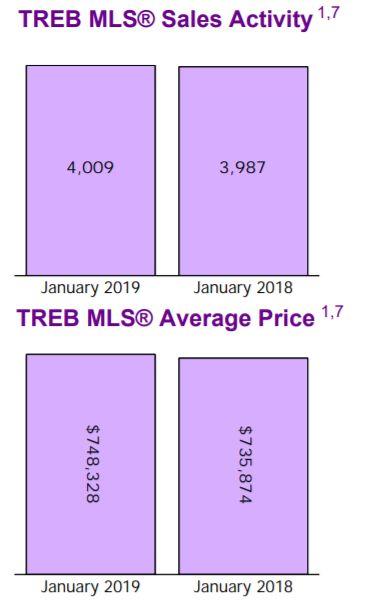
February 6, 2019 -- TREB President Garry Bhaura announced that Greater Toronto Area REALTORS® reported 4,009 home sales through TREB's MLS® in January 2019 – up by 0.6 per cent compared to January 2018. On a preliminary seasonally adjusted basis, sales were up by 3.4 per cent compared to December 2018.
"It is encouraging to see the slight increase in January transactions on a year-overyear basis, even with the inclement weather experienced in the GTA region during the last week of the month. The fact that the number of transactions edged upwards is in line with TREB's forecast for higher sales in calendar year 2019," said Mr. Bhaura.
The MLS® HPI Composite Benchmark price was up by 2.7 per cent compared to January 2018. The condominium apartment market segment continued to lead the way in terms of price growth. The average selling price was up by 1.7 per cent on a year-over-year basis. After preliminary seasonal adjustment, the average selling price edged lower compared to December 2018.
"Market conditions in January, as represented by the relationship between sales and listings, continued to support moderate year-over-year price increases, regardless of the price measure considered. Given housing affordability concerns in the GTA, especially as it relates to mortgage qualification standards, we have seen tighter market conditions and stronger price growth associated with higher density low-rise home types and condominium apartments, which have lower average selling prices compared to single detached homes," said Jason Mercer, TREB's Director of Market Analysis and Service Channels.


Mississauga Detached Home Real Market Watch-2019vs2018&2017
It's interesting to see the full year comparison for the Mississauga Detached Home market between 2018 vs 2017, please contact us at 647-7392618 for a full walk through of these charts and what does this mean for our 2019 market?
Great Toronto Area Real Estate Market Stats - December 2018
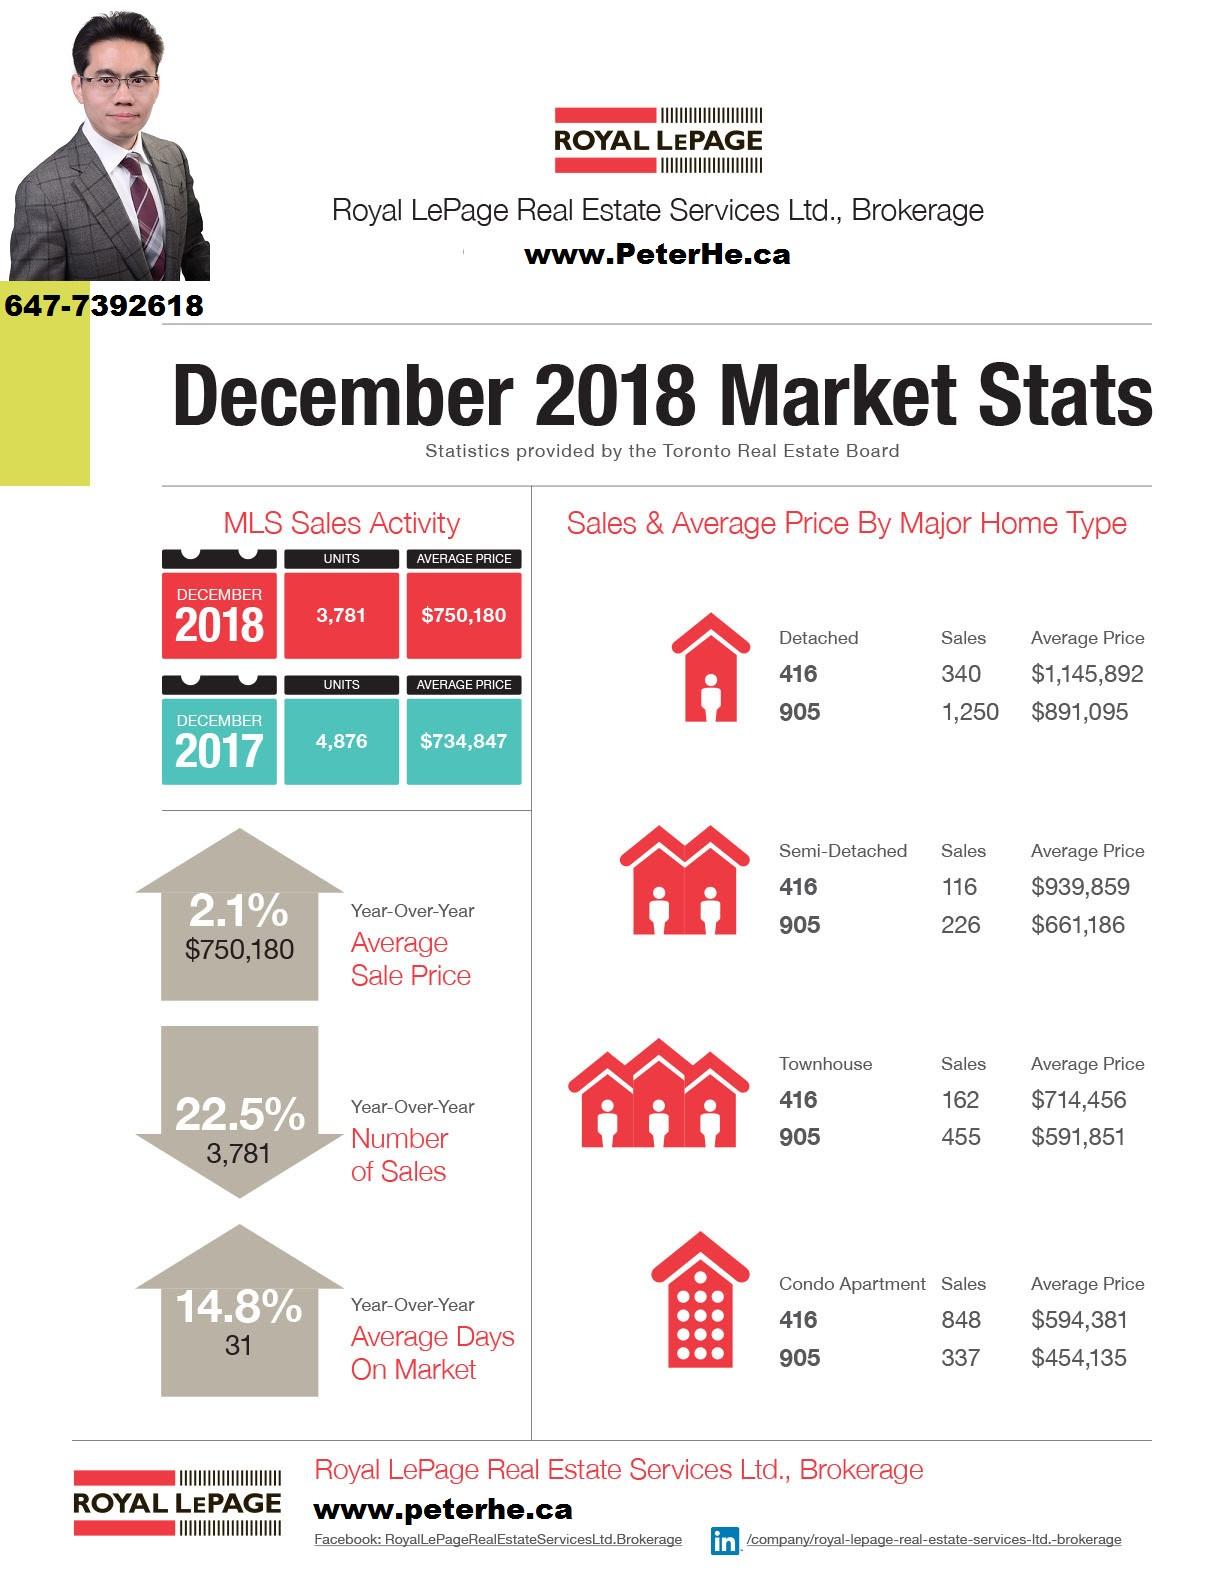
Toronto Real Estate Board President Garry Bhaura announced that Greater Toronto Area REALTORS® reported a total of 77,426 residential transactions through TREB's MLS® System in 2018. This result represented a 16.1 per cent decline compared to 92,263 sales reported in 2017. Total new listings entered into TREB's MLS® System were down by 12.7 per cent over the same period to 155,823.
Home prices were up very slightly in the City of Toronto and down in the surrounding GTA regions. This dichotomy reflects the fact that the condominium apartment segment, which accounted for a large proportion of sales in the City of Toronto, performed better from a pricing perspective than the detached market segment. The average price for condominium apartment sales across the TREB market area was up by 7.8 per cent year-over-year.The overall average selling price for 2018 transactions, at $787,300, was down by 4.3 per cent year-over-year for all home types combined across the TREB market area.
"Higher borrowing costs coupled with the new mortgage stress test certainly prompted some households to temporarily move to the sidelines to reassess their housing options. With this said, it is important to note that market conditions were improved in the second
half of the year, both from a sales and pricing standpoint," said Garry Bhaura.
"After spiking in 2017, new listings receded markedly in 2018. In many neighburhoods, despite fewer sales from a historic perspective, some buyers still struggled to find a home meeting their needs. The result was a resumption of a moderate year-over-year pace of home price growth in the second half of the year. Price growth was strongest for less expensive home types, as many home buyers sought more affordable home ownership options," said Jason Mercer, TREB's Director of Market Analysis and Service Channels.
Great Toronto Area Real Estate Market Stats - November 2018
Toronto Real Estate Board President Garry Bhaura announced the continuation of moderate price growth in November 2018 compared to November 2017. The MLS® Home Price Index (HPI) Composite Benchmark was up by 2.7 per cent year-over-year. The average selling price was up by 3.5 per cent year-over-year to $788,345.
"New listings were actually down more than sales on a year-over-year basis in November. This suggests that, in many neighbourhoods, competition between buyers may have increased. Relatively tight market conditions over the past few months have provided the foundation for renewed price growth," said Mr. Bhaura.Greater Toronto Area REALTORS® reported 6,251 residential transactions through TREB's MLS® System in November 2018. This result was down by 14.7 per cent compared to November 2017, when we saw a temporary upward shift in demand as the market was distorted by the looming OSFI-mandated stress test at the end of last year.
On a preliminary seasonally adjusted basis, sales were down by 3.4 per cent compared to October 2018. The average selling price after preliminary seasonal adjustment was down by 0.8 per cent compared to October 2018.
"Home types with lower average price points have been associated with stronger rates of price growth over the past few months. Given the impact of the OSFI-mandated mortgage stress test and higher borrowing costs on affordability, it makes sense that the condo apartment and semi-detached market segments experienced relatively stronger rates of price growth in November, as market conditions in these segments remained tight or tightened respectively over the past year," said Jason Mercer, TREB's Director of Market Analysis.
Toronto October Real Estate Market Stats - Oct 2018
Toronto Real Estate Board President Garry Bhaura announced year-over-year increases in home sales and average sale prices reported through TREB's MLS® System in October 2018.
Greater Toronto Area REALTORS® reported 7,492 sales through TREB's MLS® System in October 2018 – a six per cent increase compared to October 2017. On a preliminary seasonally adjusted basis, sales were down by one per cent compared to September 2018.
The average sale price for October 2018 was up 3.5 per cent on a year-over-year basis to $807,340. After preliminary seasonal adjustment, the average selling price was up one per cent compared to September 2018. The MLS® Home Price Index (HPI) Composite Benchmark was up by 2.6 per cent compared to October 2017. Price growth continued to be driven be the condominium apartment and higher density low-rise market segments.
"Annual sales growth has been positive since the late spring. While the OSFI stress test and higher borrowing costs have kept sales below 2016's record pace, many households in the Greater Toronto Area remain upbeat on home ownership as a quality long-term investment. A strong regional economy and steady population growth will continue to support the demand for housing ownership as we move into 2019," said Mr. Bhaura.
There were 14,431 new Listings entered into TREB's MLS® System in October 2018 – down 2.7 per cent compared to October 2017. The fact that sales were up and new listings were down year-over-year in October suggests that market conditions became tighter.
"Annual sales growth has outstripped annual growth in new listings for the last five months, underpinning the fact that listings supply remains an issue in the Greater Toronto Area. With municipal elections in the rear view mirror, all levels of government need to concentrate on policies that could remove impediments to a better-supplied housing market, including facilitating the development of a broader array of medium density housing choices," said Jason Mercer, TREB's Director of Market Analysis.
Oakville Detached Home Market Updates -Oct 2018
Compared with September the Oakville market shows some improvement, the sales is up by 4.8%, and the new listings are down by around 18%, the new listing absorption rate has increased by 8%, especially the average sold price has jumped by over 7%, however the average price indicator is tricky, it could be distorted by some higher prices properties, there were three 7 million dollar homes sold in October, without those 3 homes the average price in October would be 1.33million instead, which means no significant improvement from September yet.


Curious to know how much you could get for your home under the current market situation? Please call Peter at 647-7392618 for a full evaluation.
September Oakville detached home market is just back to buyers' market again from a balanced market in August
In September 2018, the Oakville detached home market is back to a buyers' market again. The year-over-year number of sales is down by 4.2%, and the number of active listings has gone up by 22%. As per month over month comparison, September sales is down by 4.6% than August which is a not a very good sign, seasonally the September sales normally should be better than August. And the number of new listings has jumped by 59%, which means more competition among sellers. The absorption rate ( SNLR- sales to new listings ratio) is down to 29% from August's 49%, which means Oakville is back to buyer's market from August's balanced market (SNLR>60%: sellers' market; SNLR 40-60%: balanced market; SNLR<40%, buyers' market). We've seen the most number of price reductions of listings in the past decade.
Although lots of sellers have been trying to hold on to the price by having the listings sitting on the market for 5-6 months, some sellers have to sell their homes faster for various reasons and have to drop their prices to get their homes sold.
South East Oakville used to be one of the few communities that could hold on to their prices better, but recently it's having difficulty to do so.
Some economist is predicting we might be facing a rate hike every quarter in the coming year, for a one million dollar mortgage, a 1% interest increase means $550 extra mortgage payments per month, that will put quite a bit of pressure to lots of home owners and rental property owners, the inventory level would remain high, and there're no signs of major improvements in a foreseeable future.
The Toronto Real Estate Board President Garry Bhaura said, "It is important to remember that TREB's market area is made up of over 500 communities. Market conditions have obviously unfolded differently across these communities. This is why it's important to work with a REALTOR® who is familiar with local market conditions in your areas of interest. "
Wondering how much you could possibly get for your home in the current market? Please call Peter @ 647-7392618 for a chat.


GTA Real Estate Board Release Latest Housing Market Stats-September 2018
Toronto Real Estate Board President Garry Bhaura announced that Greater Toronto Area REALTORS® reported 6,455 sales through TREB's MLS® System in September 2018 – up 1.9 per cent compared to September 2017. The average selling price for September 2018 sales was up by 2.9 per cent over the same period to $796,786. The MLS® HPI composite benchmark price was up by two per cent year-over-year.
"It is healthy to see sales and prices in many areas across the Greater Toronto Area up a bit, compared to last year's lows. At the same, however, it is important to remember that TREB's market area is made up of over 500 communities. Market conditions have obviously unfolded differently across these communities. This is why it's important to work with a REALTOR® who is familiar with local market conditions in your areas of interest," said Mr. Bhaura.New listings entered into TREB's MLS® System in September 2018 amounted to 15,920 – down by 3.1 per cent compared to September 2017. With sales up year-over-year and new listings down, market conditions became tighter. Many buyers may have found it more difficult to find a home meeting their needs.
"While higher borrowing costs and tougher mortgage qualification rules have kept sales levels off the record pace set in 2016, many households remain positive about home ownership as a quality long-term investment. As the GTA population continues to grow, the real challenge in the housing market will be supply rather than demand. The Toronto Real Estate Board is especially concerned with issues affecting housing supply as we move towards municipal elections across the region," added Mr. Bhaura.
On a monthly basis, after preliminary seasonal adjustment, sales edged up by 0.2 per cent in September 2018 compared to August 2018. The average selling price, after preliminary seasonal adjustment, edged lower by 0.5 per cent month-over-month.
"Generally speaking, annual rates of price growth have been stronger for higher density home types in 2018, including condominium apartments, townhouses and semi-detached houses. In many neighborhoods, these home types provide more affordable home ownership options. This is why a policy focus on increasing mid-density housing options throughout the GTA is important," said Jason Mercer, TREB's Director of Market Analysis.
Latest Oakville Market Stats - August 2018
The August is usually one of the weakest months of the year due to the seasonal reasons, as expected this August market has slowed further down than the last month-July 2018, from Year-over-Year perspective this August shows weaker than the August of 2017 while this July was stronger than the July of 2017, the siginifcantly hotter weather might be part of the reasons.
However during the labor day long weekend, I'm still seeing a lot more than expected buyers coming through my open houses, this might tell us the buyers are back from vacations, and more buyers are expected to get back to the market after the kids' back-to-school weeks?
I expect we should have a more active fall market this September and October, it could be another great opportunity for the sellers to sell in the next two months if you have already missed the previous selling opportunities.
Year-over-Year same month comparison: although the average sold price is up by 6%, this might be attributed to a few more higher price homes were sold this August than the August of 2017, espcially there's a 6.5million dollar home sale this August. The number of sales is down almost by 11%, the number of new listings is up by 13%, the number of active listings is up by over 19%, the number of days on market has increased by 16%, and the sales to new listings ratio is down by 12%. Overall, market of this August has worsened than the August of 2017.
Month over month comparison of the same year: the August is weaker than July in general, although the average price is up by 5.4%, the number of sales is down by almost 13%, so are the number of new listings and active listings down by 12-14% accordingly, the number of days on market is also 5 days longer.
下面是各项数据指标的逐月走势图,包括均价,交易量,新上市房源数,在市房源数,房屋售出天数,以及销量与新增库存比。
Below are the self-explanatory charts for average prices, sales, new listings, active listings, days on market and SNLR, to get a better understanding of these charts and the market on your specific neighborhood area please call Peter He at 647-7392618 for a chat.
Please subscribe my market updates newsletter by simply texting your email address to 647-7392618, or sign up through my website contact page at www.peterhe.ca to receive a full list of sold history of your neighborhood and a comprehensive market evaluation report of your home for free.
Best Time to Move Up?-Mississauga vs Oakville Detached Home Market Stats Comparison - August 2018
Interestingly, this August the Mississauga detached home market shows much stronger than Oakville, its sales volume has shot up by 49% than August of 2017, the SNLR ratio has increased by 3.1% which means the market's inventory absorbing rate is accelerating.
Although seasonally August should be weaker than July, but this August Mississauga's detached home sales and new listings have both increased by 12-14% than July, and the average price has increased moderately by 2.9%.
It seems there's a pattern on the recent GTA market recovery since last April, it's shifting from condos to houses, from lower price properties to higher price ones, from 416 area to 905 areas.
Because the current average price of Oakville detached homes is 1.38 million, that of Mississauga is 1.05 million, Oakville detached homes is over $330K higher than Mississauga, that's still around 31% higher than Mississauga, this might be one of the main reasons the Oakville market's recovery is lagging behind Mississauga, but looks like there's a good chance it may follow the pace of the latter.
Please subscribe my market updates newsletter by simply texting your email address to 647-7392618, or sign up through my website contact page at www.peterhe.ca to receive a full list of sold history of your neighborhood and a comprehensive market evaluation report of your home for free.
Oakville Market Stats - July 2018
The average detached home price of this July is down by 3.4% than the same month of last year, and the newly added and active listings are also up by 12-13%, however the number of sales is up by 34%. The SNLR(Sales to New Listings Ratio) is still in a balanced market range(40-60%) while last July it was under 40%.
To compare with last month June, due to seasonal adjustment, the price, sales volume and number of listings are all down, however the SNLR ratio is improved a bit further by 4% which could be a positive sign of market improvement.
Below are the self-explanatory charts for average prices, sales, new listings, active listings, days on market and SNLR, to get a better understanding of these charts and the market on your specific neighborhood area please call Peter at 647-7392618 for a chat.
Please subscribe my market updates newsletter through my website contact page at www.peterhe.ca to receive a full list of sold history of your neighborhood and a comprehensive market evaluation report of your home for free.
Toronto Real Estate Board Release July Market Stats
August 3, 2018 -- Toronto Real Estate Board President Garry Bhaura announced strong growth in the number of home sales and the average selling price reported by Greater Toronto Area REALTORS® in July 2018.
"Home sales result in substantial spin-off benefits to the economy, so the positive results over the last two months are encouraging. However, no one will argue that housing supply remains an issue. The new provincial government and candidates for the upcoming municipal elections need to concentrate on policies focused on enhancing the supply of housing and reducing the upfront tax burden represented by land transfer taxes, province-wide and additionally in the City of Toronto," said Mr. Bhaura.
Residential sales reported through TREB's MLS® System for July 2018 amounted to 6,961 – up 18.6 per cent compared to July 2017. Over the same period, the average selling price was up by 4.8 per cent to $782,129, including a moderate increase for detached home types. New listings in July 2018 were down by 1.8 per cent year-over-year.
Preliminary seasonal adjustment pointed to strong month-over-month increases of 6.6 per cent and 3.1 per cent respectively for sales and average price. Seasonally adjusted sales were at the highest level for 2018 and the seasonally adjusted average price reached the highest level since May 2017.
The MLS® Home Price Index (HPI) Composite Benchmark for July 2018 was down slightly compared to July 2017. However, the annual growth rate looks to be trending toward positive territory in the near future.
"We have certainly experienced an increase in demand for ownership housing so far this summer. It appears that some people who initially moved to the sidelines due to the psychological impact of the Fair Housing Plan and changes to mortgage lending guidelines have re-entered the market. Home buyers in the GTA recognize that ownership housing is a quality long-term investment," said Jason Mercer, TREB's Director of Market Analysis.
How has the Oakville market been doing since Doug Ford was elected in early June?
Hope you're enjoying a great summer season.
I'd like to keep you updated with the real market of our neighborhood. Since PC party Doug Ford was elected as the new Ontario premier, the market has gained some confidence and we've seen some more buyers entering the market, the market has shown some improvements, it may take more time to know if this improvement is going be sustainable or not.
Below is the stats for Oakville detached homes I've put together. The average price is up 4.9% from the same month of last year, and sales is up 5.7%, days on market has increased from 24 days to 28 days, although the number of increased listings has decreased by 8.4%, the total number of active listings on market has increased substantially by 25%, this means the competition among sellers remains high, selling a home is facing the challenges to be more creative, resourceful to stand out from competition.
Below is the stats for Oakville detached homes I've put together. The average price is up 4.9% from the same month of last year, and sales is up 5.7%, days on market has increased from 24 days to 28 days, although the number of increased listings has decreased by 8.4%, the total number of active listings on market has increased substantially by 25%, this means the competition among sellers remains high, selling a home is facing the challenges to be more creative, resourceful to stand out from competition.
2017 June
2018 June
Change
Avg Price
1312370
1376625
4.9%
↑
Sales
158
167
5.7%
↑
Number of New Listings
439
402
-8.4%
↓
Number of Active Listings
548
687
25.4%
↑
DOM
24
28
16.7%
↑
SNLR-Sales to New Listings Ratio
36.0%
41.5%
And this is a charts combination for the Oakville detached home market since 2012-2018:
Below is the overall market stats for entire GTA:
The above is the stats of Oakville in general, the markets of each community not always act the same way, would you like to know how the market of your specific neighborhood is doing? Please call me at 647-7392618 to discuss.