YOUR HOME DESERVES WORLD CLASS MARKETING BY THE WORLD CLASS REALTOR Peter He
GTA Real Estate Market Report
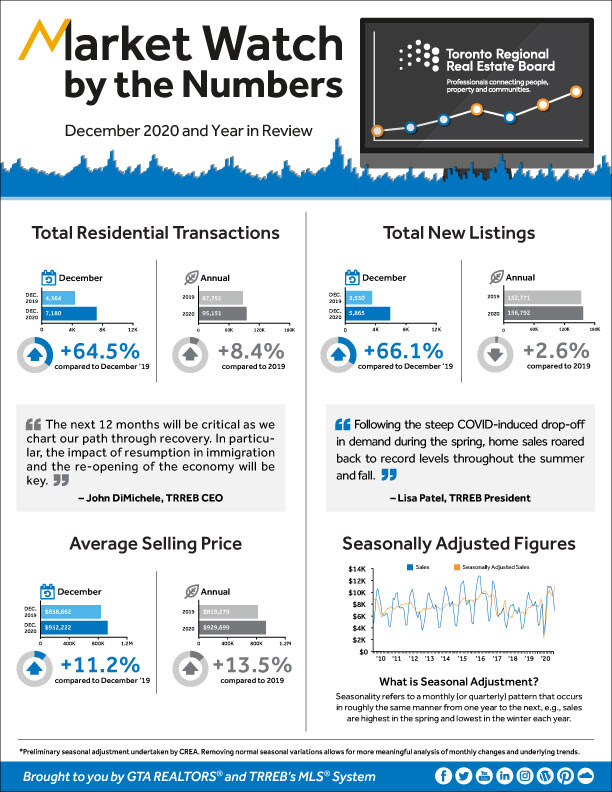
GTA Market Report - December 2020
GTA Real Estate Market Stats - November 2020
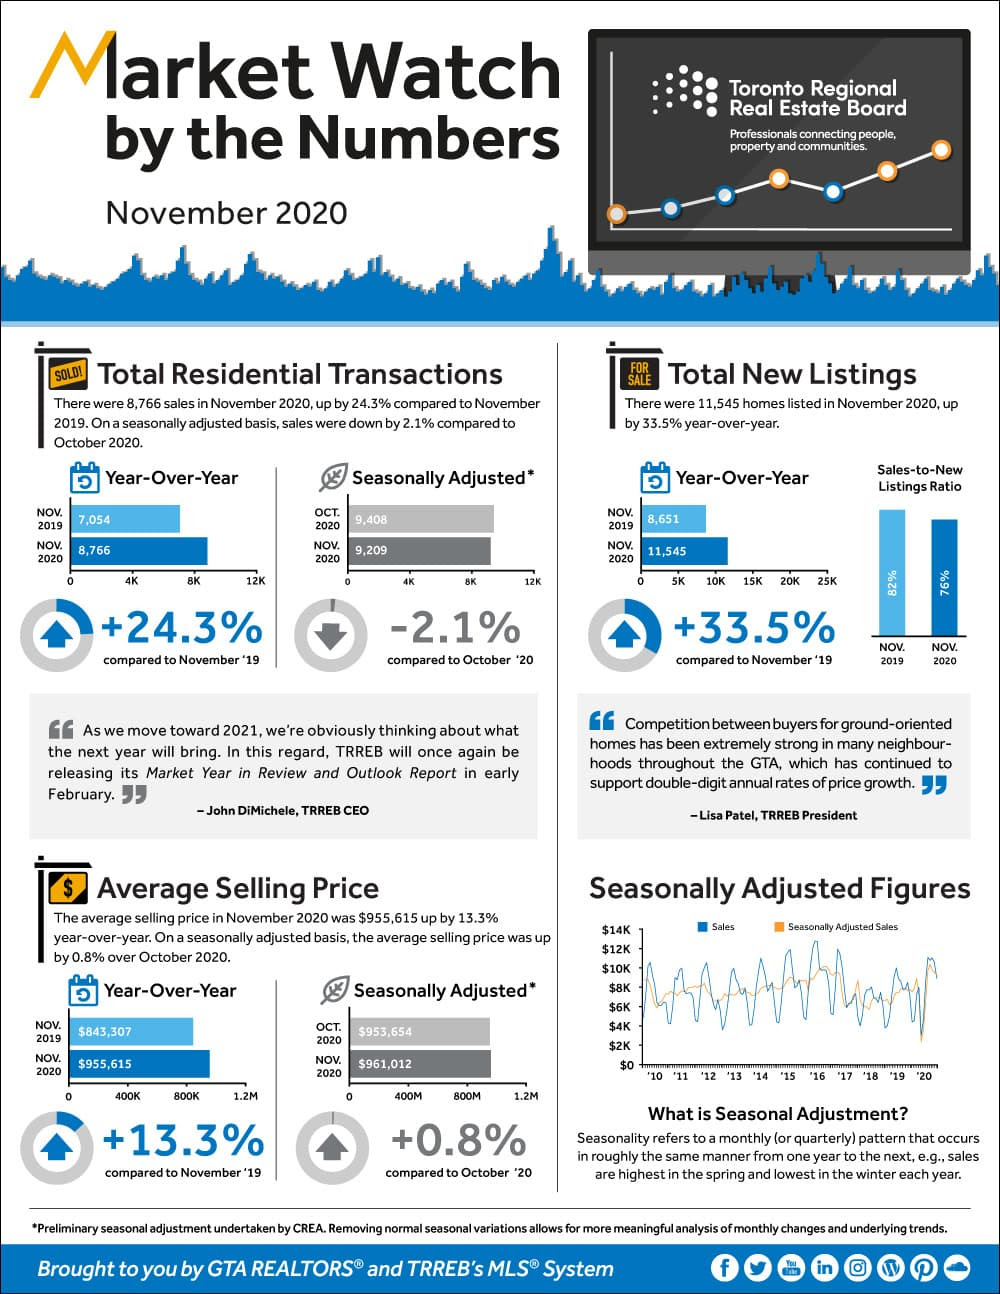
The record pace of home sales in the fall continued with 8,766 sales reported in November by Greater Toronto Area REALTORS® through the Toronto Regional Real Estate Board’s (TRREB) MLS® System. This result was up by 24.3 per cent compared to November of last year.
Generally speaking, year-over-year growth in sales was stronger for single-family homes in the GTA regions surrounding the City of Toronto, but annual single-family growth rates remained robust in the ‘416’ area code as well. “Home buyers continued to take advantage of very low borrowing costs in November, especially those looking to buy some form of single-family home. Competition between buyers for ground-oriented homes has been extremely strong in many neighbourhoods throughout the GTA, which has continued to support double-digit annual rates of price growth,” said Lisa Patel, TRREB President.
The MLS® HPI Composite Benchmark was up by 10.6 per cent in November 2020 compared to November 2019. The average selling price for all home types combined was up by 13.3 per cent to $955,615.
Market conditions tightened in many single-family market segments in November, resulting in double-digit year-over-year increases in average selling prices for detached houses, semi-detached houses and townhouses.
In contrast to the single-family market segments, buyers continued to benefit from much more choice in the condominium apartment market compared to last year, particularly in the City of Toronto. The number of new condominium apartment listings in November was almost double that reported in November of last year. More options in the condo apartment market translated into a small year-over-year decline in the average condominium apartment selling price in the ‘416’ area code.
“The condominium apartment market is certainly more balanced than in previous years, with some buyers benefitting from lower selling prices compared to last year. However, this may be somewhat of a short-term phenomenon. Once we move into the post-COVID period, we will start to see a resumption of population growth, both from immigration and a return of non-permanent residents. This will lead to an increase in demand for condominium apartments in the ownership and rental markets,” said Jason Mercer, TRREB Chief Market Analyst.
Great Toronto Area Real Estate Market Stats-October 2020
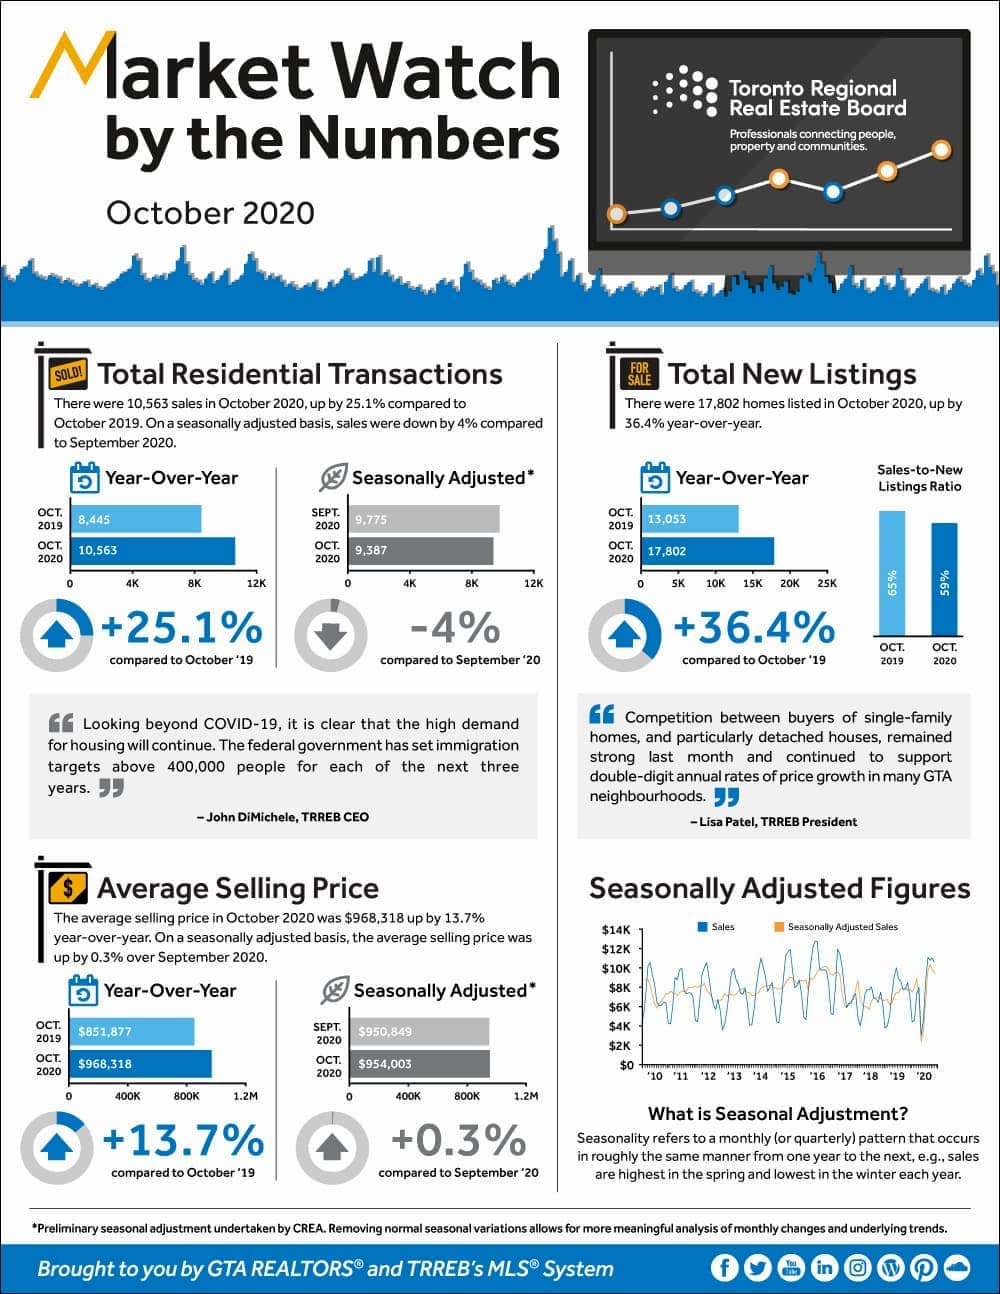
Home sales in the Greater Toronto Area (GTA) were up again year-over-year for the fourth month in a row. Our Members made 10,563 sales as reported through the Toronto Regional Real Estate Board’s MLS® System in October 2020. This was up by 25.1 per cent compared to 8,445 transactions in October 2019.
Sales and new listings reached record levels for the month of October. However, year-over-year growth rates for sales and new listings diverged in some market segments. In the detached market segment, the pace of annual sales growth far outstripped growth in new listings. Conversely, the condominium apartment market segment experienced more than double the new listings compared to October 2019, whereas sales were only up by 2.2 per cent over the same period.
“Competition between buyers of single-family homes, and particularly detached houses, remained strong last month and continued to support double-digit annual rates of price growth in many GTA neighbourhoods. In contrast, condo buyers have benefitted from much more choice compared to last year. Pre-COVID polling had already pointed to an increase in investor selling in 2020. The pandemic only added to this trend with a stall in economic growth and a halt to tourism impacting cashflows for many investors,” said Lisa Patel, TRREB’s President.
The MLS® HPI Composite Benchmark was up by 10.8 per cent on a year-over-year basis in October 2020. The average selling price for all home types combined was $968,318 – up by 13.7 per cent compared to $851,877 in October 2019.
“Year-to-date home sales through October were above last year’s level. The economic recovery in some sectors coupled with low borrowing costs has kept home purchases top-of-mind for many GTA residents. With this being said, we have not accounted for all of the pent-up demand that resulted from the spring downturn. Expect record or near-record home sales for the remainder of 2020,” said Jason Mercer, TRREB’s Chief Market Analyst.
GTA Real Estate Market September Stats-2020 September
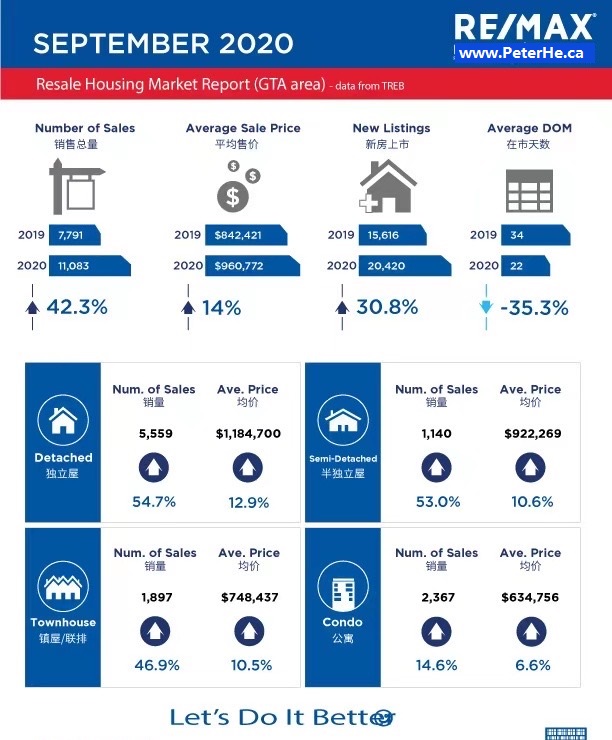
Toronto Regional Real Estate Board President Lisa Patel announced that sales reported through TRREB’s MLS® System by Greater Toronto Area REALTORS® amounted to 11,083 – a new record for the month of September. This result was up by 42.3 per cent compared to September 2019. Following a record third quarter, sales through the first nine months of 2020 were up by approximately one per cent compared to the same period in 2019.
“Improving economic conditions and extremely low borrowing costs sustained record-level sales in September, as we continued to account for the substantial amount of pent-up demand that resulted from the spring downturn. Further improvements in the economy, including job growth, would support strong home sales moving forward. However, it will be important to monitor the trajectory of COVID-19 cases, the related government policy response, and the impact on jobs and consumer confidence,” said Ms. Patel.
Year-over-year sales growth in September continued to be driven by ground-oriented market segments, including detached and semi-detached houses and townhouses. Annual growth rates were also higher for sales reported in the GTA regions surrounding the City of Toronto.
The September 2020 MLS® Home Price Index Composite Benchmark was up by 11.6 per cent year-over-year. The average selling price for all home types combined in September was $960,772 – up by 14 per cent year-over-year. Price growth was driven by the low-rise market segments. The relatively better supplied condominium apartment segment experienced a comparatively slower pace of price growth.
“On a GTA-wide basis, market conditions tightened in September relative to last year, with sales increasing at a faster pace than new listings. With competition between buyers increasing noticeably, double-digit year-over-year price growth was commonplace throughout the region in September, resulting in the overall average selling price reaching a new record,” said Jason Mercer, TRREB’s Chief Market Analyst.
https://communications.torontomls.net/mlshome/index.php/more/market-stats/market-stats-quick-overview#residential-stats
GTA Real Estate Market Report - August 2020

Toronto Regional Real Estate Board (TRREB) President Lisa Patel announced that the strong rebound in Greater Toronto Area (GTA) home sales continued with a record result for the month of August. GTA REALTORS® reported 10,775 residential sales through TRREB’s MLS® System in August 2020 – up by 40.3 per cent compared to August 2019.
Sales were up on a year-over-year basis for all major home types, both in the City of Toronto and surrounding GTA regions. It should be noted that the low-rise market segments, including detached and semi-detached houses and townhouses, were the drivers of sales growth. Condominium apartment sales were up on an annual basis for the second straight month but to a lesser degree.
“Increased demand for ownership housing has been based on improving economic conditions, in terms of monthly GDP growth and job creation, and the continuation of very low borrowing costs. In addition, fewer households have chosen to go on vacation as a result of COVID-19 and instead have remained in the GTA and been active in the housing market, satisfying pent-up demand from the spring,” said Ms. Patel.
Both the number of new listings entered into TRREB’s MLS® System during the month and the number of active listings at the end of the August 2020 were up on a year-over-year basis. While new listings were up strongly for all home types, growth in new condominium apartment listings far outstripped growth in the other market segments.
“Generally speaking, market conditions remained very tight in the GTA resale market in August. Competition between buyers was especially strong for low-rise home types, leading to robust annual rates of price growth. However, with growth in condominium apartment listings well-outstripping condo sales growth, condo market conditions were comparatively more balanced, which was reflected in a slower pace of price growth in that segment,” said Jason Mercer, TRREB’s Chief Market Analyst.
The MLS® Home Price Index Composite Benchmark was up by 11.1 per cent in August 2020 compared to August 2019. Over the same period, the overall average selling price was up by 20.1 per cent to $951,404. Annual detached and semi-detached sales growth was stronger in the comparatively more-expensive City of Toronto compared to the surrounding GTA regions, which helps explain why growth in the overall average selling price outstripped growth in the MLS® HPI Composite Benchmark.
GTA Market Watch by the Numbers(July 2020)


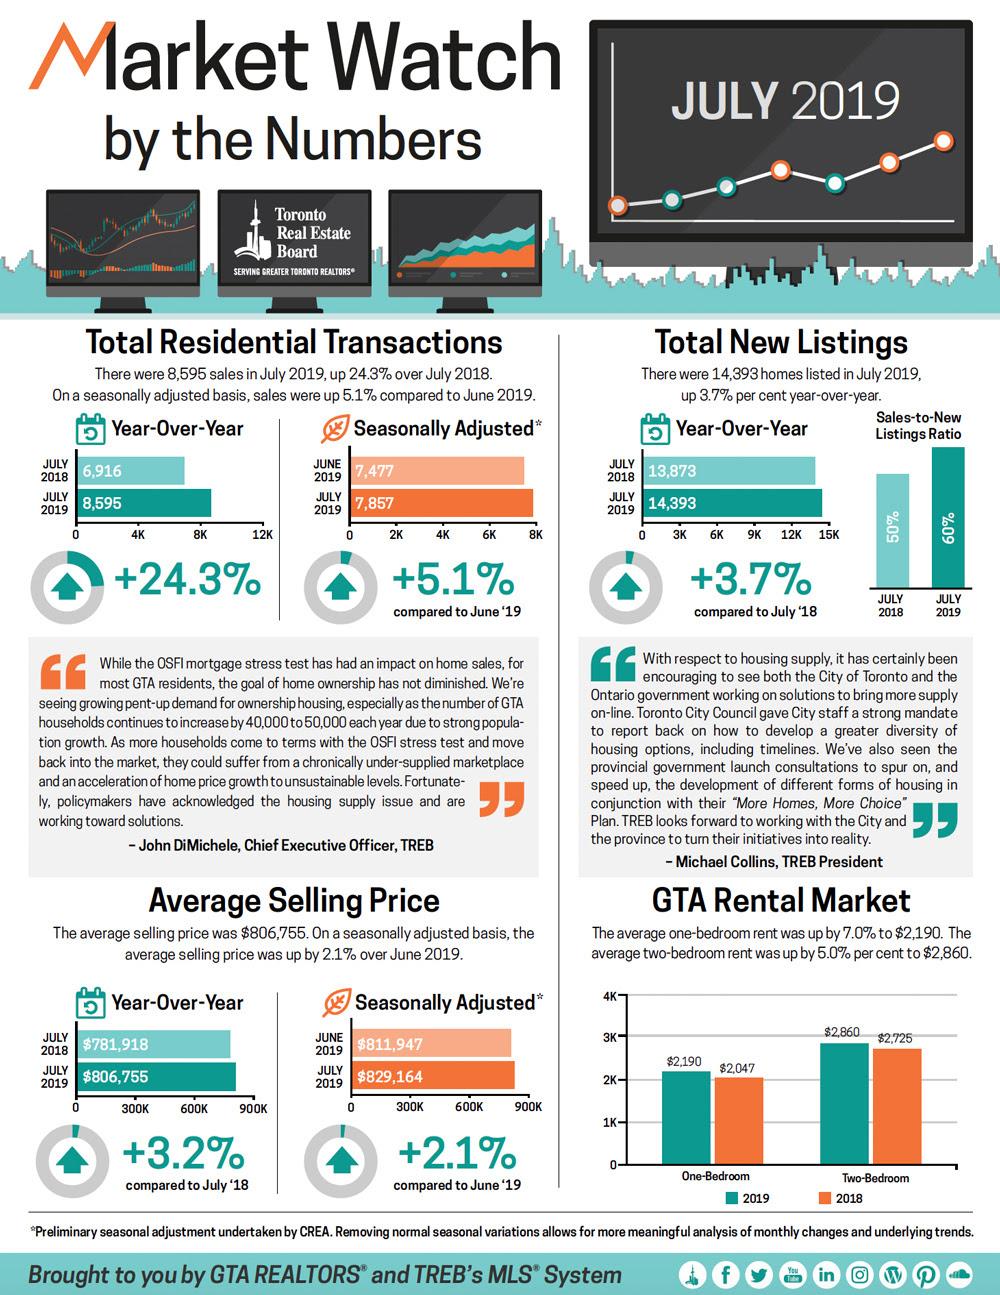
Toronto Regional Real Estate Board President Lisa Patel announces that Greater Toronto Area REALTORS® reported 11,081 sales through TRREB’s MLS® System in July 2020 – a 29.5 per cent increase over July 2019 and a new record for the month of July. On a preliminary seasonally adjusted basis, sales were up by 49.5 per cent compared to June 2020.
Year-over-year sales growth was driven by low-rise home types, particularly in the regions surrounding the City of Toronto. However, condominium apartment sales were also up on an annual basis, including in Toronto. Total new listings were also up strongly on a year-over-year basis by 24.7 per cent, but this annual growth rate was less than that of sales, which means market conditions tightened on average compared to July 2019. In addition, active listings at the end of July were down by 16.3 per cent.
“Sales activity was extremely strong for the first full month of summer. Normally we would see sales dip in July relative to June as more households take vacation, especially with children out of school. This year, however, was different with pent-up demand from the COVID-19-related lull in April and May being satisfied in the summer, as economic recovery takes firmer hold, including the Stage 3 re-opening. In addition, fewer people are travelling, which has likely translated into more transactions and listings,” said Ms. Patel.
The July 2020 MLS® Home Price Index (HPI) Composite Benchmark was up by 10 per cent compared to July 2019. The overall average selling price was up by 16.9 per cent year-over-year to $943,710. On a preliminary seasonally adjusted basis, the average selling price was up by 5.5 per cent compared to June 2020.
Price growth was strongest for low-rise home types, notably within the City of Toronto. Despite more balanced market conditions in the condominium apartment market segment, year-over-year price growth remained in the high single digits.
“Competition between buyers continued to increase in many segments of the GTA ownership housing market in July, which fueled a further acceleration in year-over-year price growth in July compared to June. On top of this, we also experienced stronger sales growth in the more-expensive detached market segment, which helps explain why annual growth in the overall average selling price was stronger than growth for the MLS® HPI Composite benchmark,” said Jason Mercer, TRREB’s Chief Market Analyst.
GTA May 2020 Real Estate Market Stats

Toronto Regional Real Estate Board President Michael Collins announced that Greater Toronto Area REALTORS® reported 4,606 sales through TRREB’s MLS® System in May 2020. This result was down by 53.7 per cent compared to May 2019. While the number of sales was down substantially on a year-over-year basis due to the continued impact of COVID-19, the decline was less than the 67.1 per cent year-over-year decline reported for April 2020.
On a month-over-month basis, actual and seasonally adjusted May sales were up substantially compared to April. Actual May 2020 sales increased by 55.2 per cent compared to April 2020. After accounting for the regular seasonal increase that is experienced each year between April and May, seasonally adjusted sales were up by 53.2 per cent month-over-month.
The number of new listings entered into TRREB’s MLS® System in May was down by a similar annual rate to that of sales, dipping by 53.1 per cent to 9,104. On a month-over-month basis, actual new listings were up by 47.5 per cent.
The MLS® Home Price Index Composite Benchmark price was virtually unchanged in May 2020 compared to April 2020. On a year-over-year basis, the composite benchmark was up by 9.4 per cent. The average selling price for all home types combined was up by three per cent compared to May 2019 to $863,599. On a seasonally adjusted basis, the average selling price was up by 4.6 per cent month-over-month compared April 2020.
The difference in year-over-year growth between the MLS® HPI Composite Benchmark and the average selling price was related to the fact that home sales in the City of Toronto, particularly in the detached segment, were down by a greater annual rate than overall sales in the GTA. This resulted in a compositional impact on the overall average selling price.


Great Toronto Area Real Estate Market Report - April 2020

Home Sales and Listings
- Greater Toronto Area REALTORS® reported 2,975 residential transactions through TRREB’s MLS® System. This result was down by 67 per cent compared to April 2019. Weekday sales remained within a relatively steady range during the month, averaging 130 per day.
- New listings amounted to 6,174 in April 2020 – down on a year-over-year basis by a similar rate compared to sales (-64.1 per cent).
Home Prices
- The average selling price for April 2020 transactions was $821,392 – up by 0.1 per cent compared to the average price of $820,373 reported for April 2019. The semi-detached and townhouse market segments experienced annual average price growth above the rate of inflation. The condominium apartment and detached segments experienced year-over-year price declines on average.
- The trend for the MLS® Home Price Index Composite Benchmark, which had been on an upward trajectory since the beginning of 2019 flattened in April. On a year-over-year basis, the Benchmark was up by 10 per cent.
- The MLS® HPI indices represent prices for typical homes with consistent attributes from one period to the next. The fact that the MLS® HPI was up year-over-year by a greater rate than the average selling price suggests that the share of higher end deals completed in April 2020 versus April 2019 was down.


How would COVID-19 be Impacting the GTA Housing Market?
COVID-19 seems to be making a much bigger impact on Canada and the whole world this year than the SARS did in 2003.
In Canada this year so far COVID-19 has already reported over 44000 confirmed cases and 2300 deaths, the numbers are still climbing. While in 2003 Canada had 438 SARS cases and 44 deaths.
in China, the COVID-19 caused 81807 people infected, 3283 deaths so far, while the 2003 SARS only had 5,327 people infected and 349 deaths, it was at least 10 times worse. And COVID-19 has much more serious impact in Europe especially Italy, Spain and USA than SARS did in 2003.
While our present situation is very different and it seems much worse, we may still take some lessons from the past.
While real estate is rightly a much lower concern as we worry about the health of our family, friends and fellow human beings in our communities and around the world during this unprecedented COVID-19 (Coronavirus) public health crisis, many of us are also worried about our jobs as industries face slowdown and our personal finances as stocks take a major hit.
This worry has extended to the residential real estate market.
Given this, it's worth taking a look back at the impact of the 2003 SARS crisis on real estate.
In 2003, Toronto was one of the hardest-hit cities in the world during the SARS outbreak.
The first reported case of SARS in Toronto was in February 2003 and two months later the World Health Organization (WHO) issued a travel advisory against Toronto.
By June, the WHO had lifted the travel advisory and Toronto was also officially removed from the WHO list of “Affected Areas".
So how did Toronto’s real estate market react during the first six months of 2003 of the SARS crisis and in the following six months of its immediate aftermath?
You can see from the chart below that during the first four months of 2003 the change in home sales in the Greater Toronto Area (GTA) were negative when compared to the previous year. Sales picked up slightly in May and June and by July when Toronto was no longer considered an affected area, sales surged by over 60% and remained positive for the remainder of the year.


When looking at the change in house prices, we can see that there was no decline in house prices during SARS. For most of the second half of 2002 home prices in the GTA were increasing in the 10-15% range, which means that the decline in sales just lowered the rate of growth in house prices. Instead of prices rising by 12% per year, 6% became the norm during SARS.

We may be likely going to see a similar trend in the GTA in the coming months, however as the COVID-19 could cause much deeper impact on the global and Canada's economy and job market, the impact could be different.
Home sales in the GTA in February were growing by over 40% compared to last year and prices were growing by just under 20%. Even if fifty percent of Toronto area home buyers step out of the market, we would still have a competitive seller’s market with roughly 2.5 months of inventory. Homes would still sell quickly but instead of getting 15 offers on their offer nights they might get 1-3 offers.
Buyers will still be out buying homes, sellers will still be selling and if we see a bit more calm and balance in Toronto’s real estate market as a result of the Coronavirus, that’s not a bad thing - though, of course, not worth the heartbreaking loss of life.
Take care of yourselves and each other and stay well. Thinking of selling but not sure how to manage your selling in this difficult situation? Please call Peter He at 647-7392618 for an obligation free consultation.

GTA March 2020 Housing Market Stats

Toronto Regional Real Estate Board President Michael Collins announced that Greater Toronto Area REALTORS® reported 8,012 home sales through TRREB’s MLS® System in March 2020 – up by 12.3 per cent compared to 7,132 sales reported in March 2019.
However, despite a strong increase in sales for March 2020 as a whole, there was a clear break in market activity between the pre-COVID-19 and post-COVID-19 periods. For the purposes of this release, the start of the post-COVID-19 period was the week beginning Sunday, March 15.
• The overall March sales result was clearly driven by the first two weeks of the month. There were 4,643 sales reported in the pre-COVID-19 period, accounting for 58 per cent of total transactions and representing a 49 per cent increase compared to the first 14 days of March 2019.
• There were 3,369 sales reported during the post-COVID-period – down by 15.9 per cent compared to the same period in March 2019.
For March as a whole, new listings were up by three per cent year-over-year to 14,424. However, similar to sales, new listings dropped on a year-over-year basis during the second half of the month (beginning March 15) by 18.4 per cent.
The MLS® Home Price Index Composite Benchmark price was up by 11.1 per cent year-over-year in March 2020. The average selling price for March 2020 as a whole was $902,680 – up 14.5 per cent compared to March 2019. The average selling price for sales reported between March 15 and March 31, was $862,563 – down from the first half of March 2020, but still up by 10.5 per cent compared to the same period last year.


GTA Housing Market Stats - February 2020

In line with the forecast contained in the Toronto Regional Real Estate Board’s recently released Market Year in Review and Outlook Report, TRREB President Michael Collins announced a very strong year-over-year sales and price growth in February 2020.
Greater Toronto Area REALTORS® reported 7,256 residential transactions through TRREB’s MLS® System in February 2020, representing a 45.6 per cent increase compared to a 10-year sales low in February 2019. However, February 2020 sales were still below the 2017 record result. Year-over-year sales growth, for the GTA as a whole, was strongest for ground-oriented home types.
After preliminary seasonal adjustment, February 2020 sales also exhibited positive momentum, up by 14.8 per cent compared to January 2020.
New listings amounted to 10,613 in February 2020, a 7.9 per cent increase compared to February 2019. This moderate annual growth rate was much smaller than that reported for sales, which means market conditions tightened considerably over the past year.
As market conditions tightened over the past year, competition between buyers has clearly increased. This resulted in a further acceleration in year-over-year price growth in February. The MLS® Home Price Index Composite Benchmark was up by 10.2 per cent. The average selling price for all home types combined was up by 16.7 per cent to $910,290. Double-digit average price growth was experienced for most major market segments, including detached houses and condominium apartments.
2020 January GTA Market Trend

GTA REALTORS® Release January 2020 Stats
GTA REALTORS® Release January 2020 Stats
TRREB President Michael Collins announced that Greater Toronto Area REALTORS® reported 4,581 home sales through TRREB’s MLS® System in January 2020 – up by 15.4 per cent compared to January 2019. On a preliminary seasonally adjusted basis, sales were up by 4.8 per cent compared to December 2019.
“We started 2020 where 2019 left off, with very strong growth in the number of sales up against a continued dip in the number of new and available listings. Tighter market conditions compared to a year ago resulted in much stronger growth in average selling prices. Steady population growth, low unemployment and low borrowing costs continued to underpin substantial competition between buyers in all major market segments,” said Mr. Collins.
The MLS® HPI Composite Benchmark price was up by 8.7 per cent compared to January 2019 – the highest annual rate of growth for the Benchmark since October 2017. The condominium apartment market segment continued to lead the way in terms of MLS HPI® price growth, but all home types experienced price growth above seven per cent when considering the TRREB market area as a whole. The average selling price in January was up by 12.3 per cent, driven by the detached and condominium apartment segments in the City of Toronto.
“A key difference in the price growth story in January 2020 compared to January 2019 was in the low-rise market segments, particularly with regard to detached houses. A year seems to have made a big difference. It is clear that many buyers who were on the sidelines due to the OSFI stress test are moving back into the market, driving very strong year-over-year sales growth in the detached segment. Strong sales up against a constrained supply continues to result in an accelerating rate of price growth,” said Jason Mercer, TRREB’s Director of Market Analysis and Service Channels.
GTA REALTORS® Release December and Annual 2019 Stats
Toronto Real Estate Board President Michael Collins reported that December 2019 residential sales reported through TREB's MLS® System by Greater Toronto Area REALTORS® were up by 17.4 per cent year-over-year to 4,399. Total sales for calendar year 2019 amounted to 87,825 – up by 12.6 per cent compared to the decade low 78,015 sales reported in 2018. On an annual basis, 2019 sales were in line with the median annual sales result for the past decade.
While sales were up in 2019, the number of new listings entered into TREB's MLS® System was down by 2.4 per cent year-over-year. For the past decade, annual new listings have been largely in a holding pattern between 150,000 and 160,000, despite the upward trend in home prices over the same period."We certainly saw a recovery in sales activity in 2019, particularly in the second half of the year. As anticipated, many home buyers who were initially on the sidelines moved back into the market place starting in the spring. Buyer confidence was buoyed by a strong regional economy and declining contract mortgage rates over the course of the year," said Mr. Collins.
"Over the last ten years, TREB has been drawing attention to the housing supply issue in the GTA. Increasingly, policy makers, research groups of varying scope and other interested parties have acknowledged that the lack of a diverse supply of ownership and rental housing continues to hamper housing affordability in the GTA. Taking 2019 as an example, we experienced a strong sales increase up against a decline in supply. Tighter market conditions translated into accelerating price growth. Expect further acceleration in 2020 if there is no relief on the supply front," said Jason Mercer, TREB's Chief Market Analyst.
The MLS® Home Price Index Composite Benchmark was up by 7.3 per cent on a year-over-year basis in December 2019. From June 2019 onward, the annual growth rate in the MLS® HPI Composite Benchmark accelerated. The average selling price in December 2019 was $837,788 – up almost 12 per cent year-over-year. For calendar year 2019, the average selling price was $819,319 – up by four per cent compared to $787,856 in 2018.
GTA Market Watch - October 2019

GTA REALTORS® Release September 2019 Great Toronto Area Real Estate market Stats

October 3, 2019 -- Toronto Real Estate Board President Michael Collins announced that Greater Toronto Area REALTORS® reported 7,825 sales through TREB's MLS® System in September 2019. This result represented strong year-over-year sales growth of 22 per cent compared to 6,414 sales reported in September 2018. It is important to note, however, that sales remain well-below the record September 2016 peak of more than 9,800 sales.
The supply of listings continued to be a concern in September 2019, with new listings down by 1.9 per cent year-over-year to 15,611. We have experienced multiple months this year wherein the annual rate of sales growth outpaced the annual rate of new listings growth, resulting in the overall number of active listings at month-end being well-below last year's levels. This speaks to tightening market conditions and an accelerating annual rate of price growth.On a preliminary seasonally adjusted basis, the September 2019 sales level remained in virtually the same as the August 2019 result.
The annual rate of price growth in September reached the highest point so far in 2019. The MLS® Home Price Index (HPI) Composite Benchmark was up by 5.2 per cent on a year-over-year basis in September. The average selling price for all home types combined was up by a similar annual rate of 5.8 per cent to $843,115.
On a preliminary seasonally adjusted basis, the September 2019 average selling price was up by 1.2 per cent compared to August 2019.
GTA REALTORS® Release August 2019 Stats
Toronto Real Estate Board President Michael Collins announced that Greater Toronto Area REALTORS® reported 7,711 residential sales through TREB's MLS® System in August 2019. This result represented a 13.4 per cent increase compared to 6,797 sales reported in August 2018. On a monthover- month basis, after preliminary seasonal adjustment, sales were up by 0.8 per cent.
Market conditions also became tighter in August 2019 compared to a year ago because, while sales were up year-over-year, new listings were down by three per cent over the same time period to 11,789. Year-to-date, growth in sales has well outstripped growth in new listings. This is why overall active listings counted at the end of August were down by more than 11 per cent compared to August 2018.GTA-wide sales were up on a year-over-year basis for all major market segments, with annual rates of sales growth strongest for low-rise home types including detached houses. This reflects the fact that demand for more expensive home types was very low in 2018 and has rebounded to a certain degree in 2019, albeit not back to the record levels experienced in 2016 and the first quarter of 2017.
The MLS® Home Price Index Composite Benchmark for August 2019 was up by 4.9 per cent on a year-over-year basis. The average selling price, at $792,611 in August 2019, was up by 3.6 per cent year-over-year. Both the MLS® HPI benchmark prices and average selling prices were up on an annual basis for major market segments. The condominium apartment segment continued to lead the way in terms of price growth, followed by higher density low-rise home types and finally detached houses.
GTA Market Watch by the Numbers(July 2019)
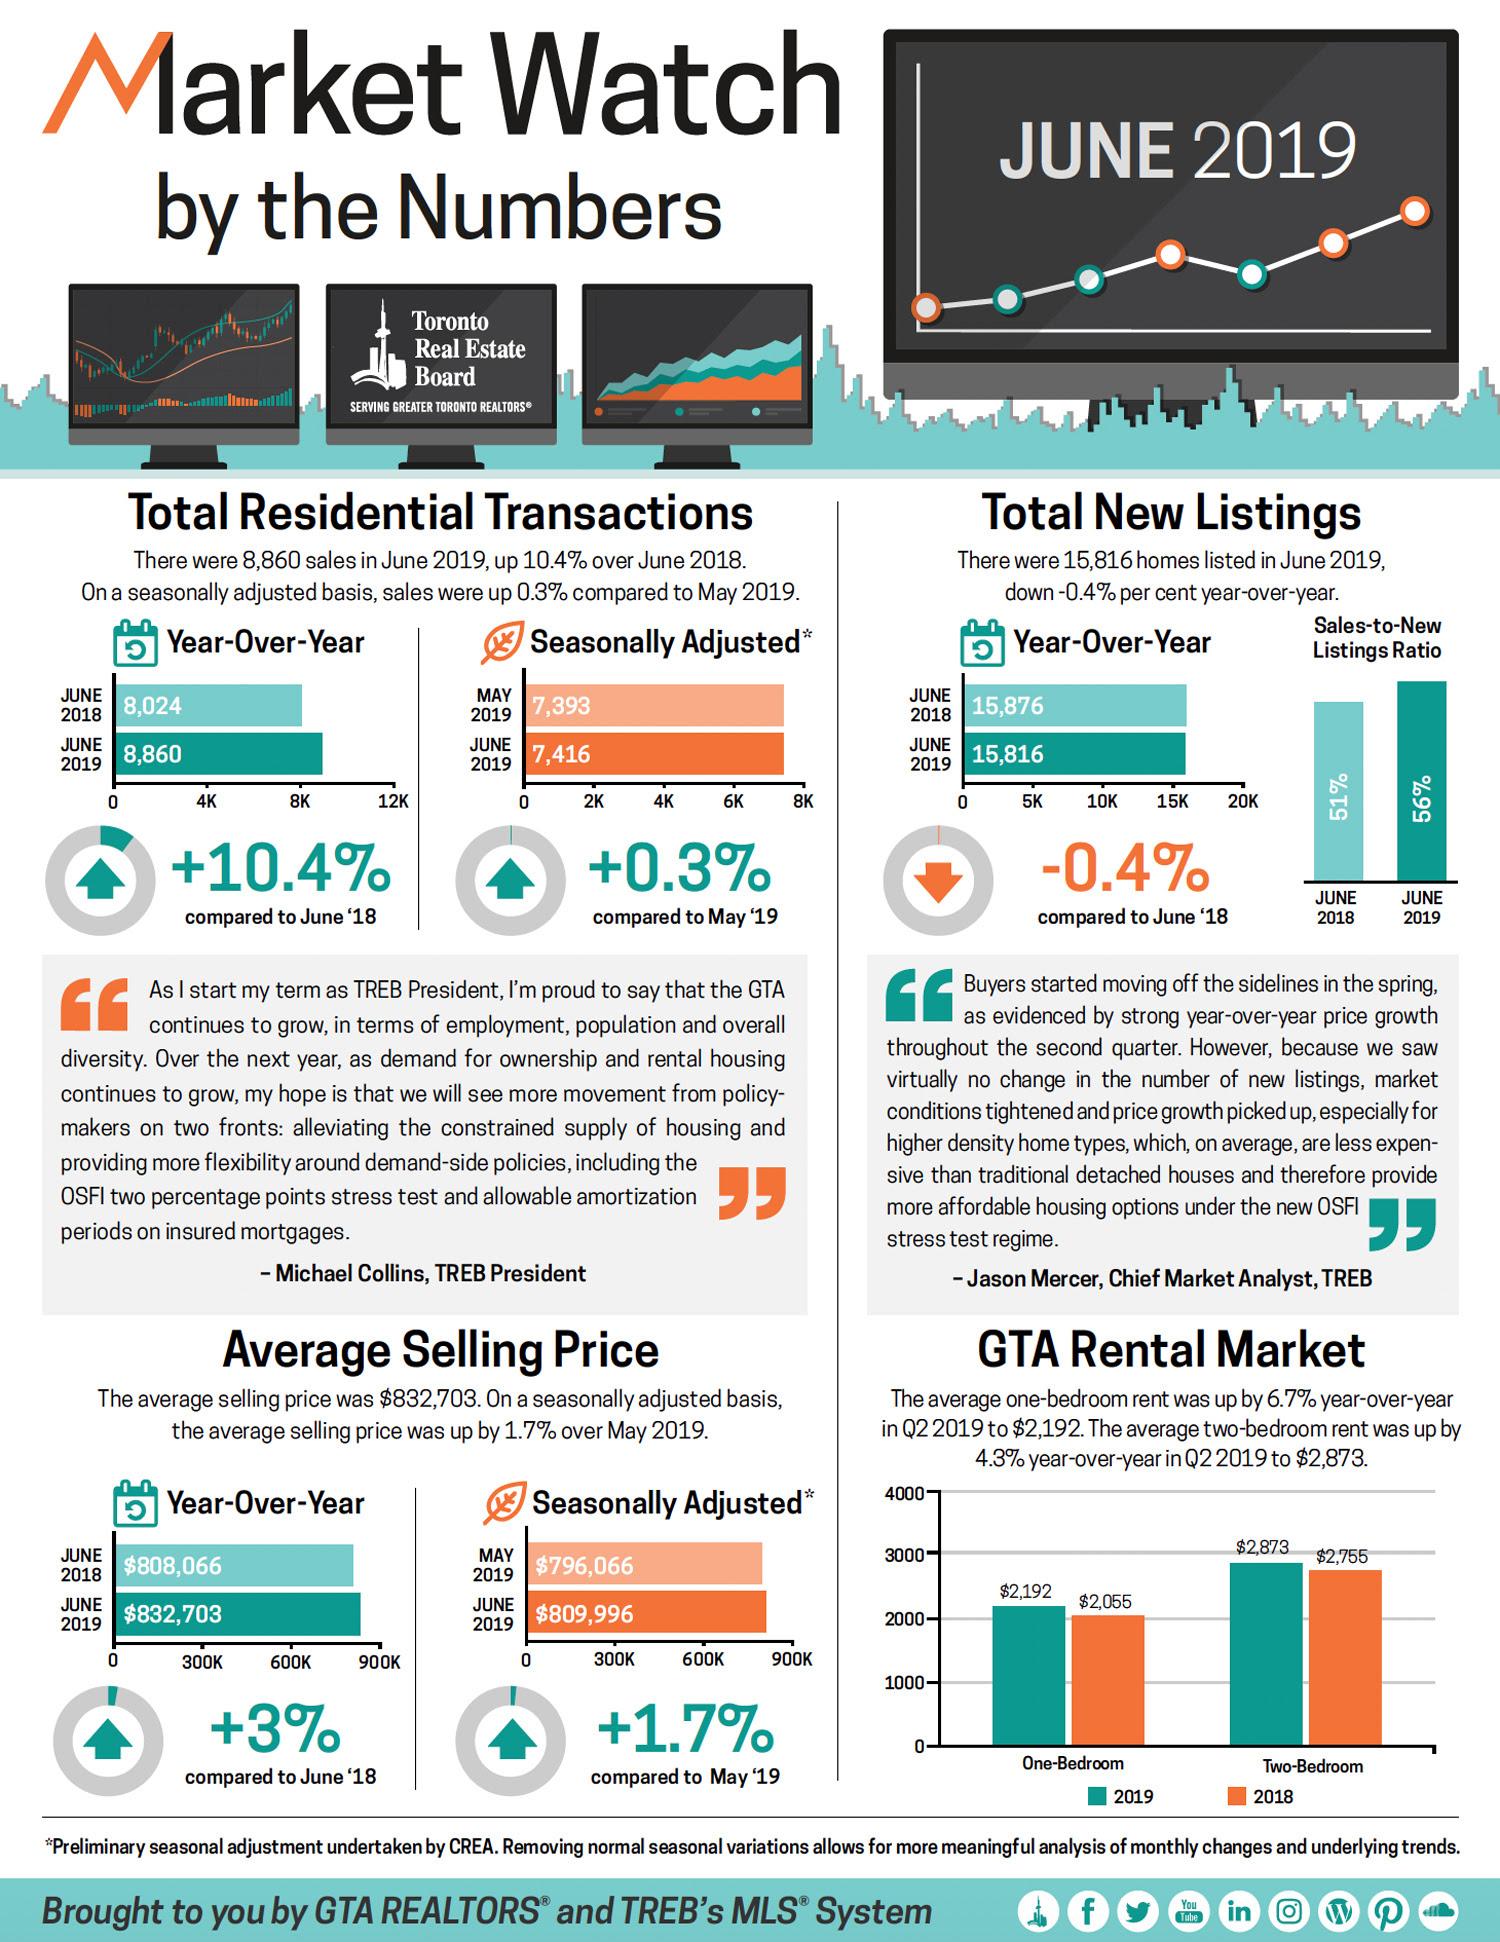
GTA Market Watch by the Numbers(June 2019)
The trademarks MLS®, Multiple Listing Service® and the associated logos are owned by CREA and identify the quality of services provided by real estate professionals who are members of CREA.
REALTOR® contact information provided to facilitate inquiries from consumers interested in Real Estate services. Please do not contact the website owner with unsolicited commercial offers.
Copyright© 2024 Jumptools® Inc. Real Estate Websites for Agents and Brokers